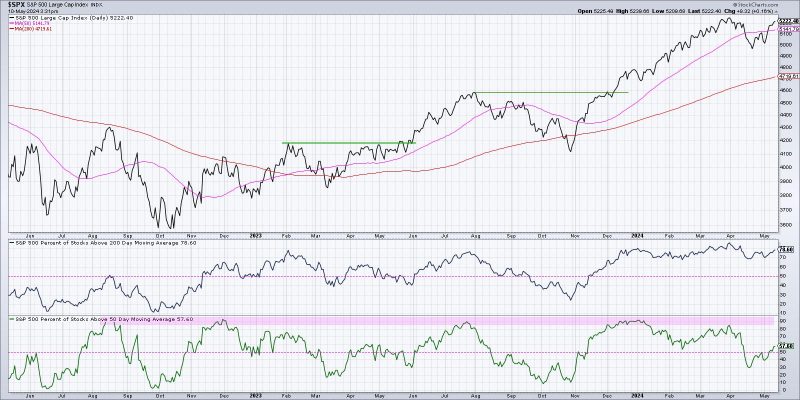
Market Breadth Indicators: Key Factors to Confirm a Bullish Trend
**1. Advance-Decline Line (A/D Line)**
One of the most commonly used market breadth indicators is the Advance-Decline Line (A/D Line). This indicator reflects the number of advancing stocks versus the number of declining stocks in a given market. A rising A/D Line suggests that more stocks are increasing in value compared to those declining, indicating a broad-based bullish trend.
The A/D Line can provide valuable insights into the underlying strength or weakness of a market trend. When the A/D Line is trending higher along with the broader market indices, it confirms the bullish momentum. On the other hand, a divergence between the A/D Line and the market indices could indicate a potential reversal or weakening of the current trend.
Traders and investors often use the A/D Line as a complementary tool to confirm the sustainability of a bullish market trend. By analyzing the relationship between advancing and declining stocks, market participants can gain a better understanding of market breadth and potential future price movements.
**2. New Highs-New Lows**
Another important breadth indicator is the New Highs-New Lows ratio, which compares the number of stocks hitting new highs versus new lows over a specific period. A high ratio of new highs to new lows suggests strong market participation and confidence in the current uptrend. Conversely, a low ratio may indicate a lack of broad-based strength and potential weakness in the market.
Monitoring the New Highs-New Lows ratio can help traders identify shifts in market sentiment and potential trend reversals. A consistently high ratio signifies a healthy uptrend with widespread participation across different sectors and industries. On the contrary, a declining ratio could signal deteriorating market breadth and lack of conviction among market participants.
By paying attention to the relationship between new highs and new lows, investors can gauge the breadth of the market rally and assess the likelihood of a sustained bullish trend. Understanding the underlying dynamics of market breadth can enhance decision-making and risk management strategies in a dynamic trading environment.
**3. McClellan Oscillator**
The McClellan Oscillator is a popular market breadth indicator that measures the difference between advancing and declining issues on a market-weighted basis. This oscillator is based on exponential moving averages and helps traders assess the breadth and strength of a market trend.
A positive McClellan Oscillator reading indicates that advancing stocks are outperforming declining stocks, suggesting a bullish market environment. Conversely, a negative reading may imply weakening market breadth and potential distribution among market participants.
Traders often use the McClellan Oscillator to confirm the sustainability of a market rally and identify overbought or oversold conditions. By analyzing the oscillator’s movements in conjunction with price action, investors can make informed decisions about market entries, exits, and position sizing.
In conclusion, market breadth indicators play a crucial role in confirming and validating a bullish market trend. By examining metrics such as the Advance-Decline Line, New Highs-New Lows ratio, and McClellan Oscillator, traders can gain valuable insights into the strength and breadth of market movements. Incorporating these breadth indicators into technical analysis can enhance market analysis and improve trading outcomes in both bullish and bearish market environments.

