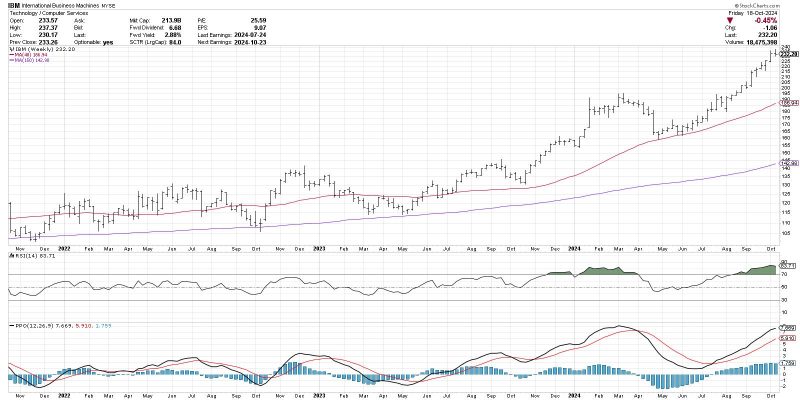
Unveiling the Secret: How the MACD Histogram Predicts Trend Changes.
The MACD Histogram: A Powerful Tool for Anticipating Trend Changes
Understanding market trends and being able to anticipate changes is crucial for successful trading. One tool that many traders use to help with this is the MACD histogram. The MACD histogram is a momentum indicator that shows the difference between the MACD line and the signal line, which are both derived from the MACD indicator.
The MACD histogram is particularly useful for identifying trend changes because it shows changes in momentum before they are reflected in the price action. By paying attention to the MACD histogram, traders can get a sense of the strength of a trend and whether it is likely to continue or reverse.
One key way that traders use the MACD histogram is to look for divergences between the histogram and price action. A bullish divergence occurs when the price makes a lower low, but the MACD histogram makes a higher low. This can signal that the downtrend is losing momentum and that a reversal may be imminent. Conversely, a bearish divergence occurs when the price makes a higher high, but the MACD histogram makes a lower high, indicating that the uptrend may be running out of steam.
Another way that traders use the MACD histogram is by looking for crossovers between the histogram and the zero line. A crossover above the zero line can indicate a shift from a bearish to a bullish trend, while a crossover below the zero line can signal a shift from a bullish to a bearish trend.
It’s important to remember that no indicator is foolproof, and the MACD histogram is no exception. Like any tool, it has its limitations and should be used in conjunction with other forms of analysis. Additionally, it’s essential to consider other factors such as support and resistance levels, volume, and market sentiment when making trading decisions.
In conclusion, the MACD histogram is a powerful tool for anticipating trend changes in the market. By observing divergences and crossovers, traders can gain valuable insights into the strength and direction of a trend. However, it’s crucial to use the MACD histogram as part of a comprehensive trading strategy and not rely on it exclusively. With careful analysis and prudent risk management, traders can harness the predictive power of the MACD histogram to improve their trading performance.
