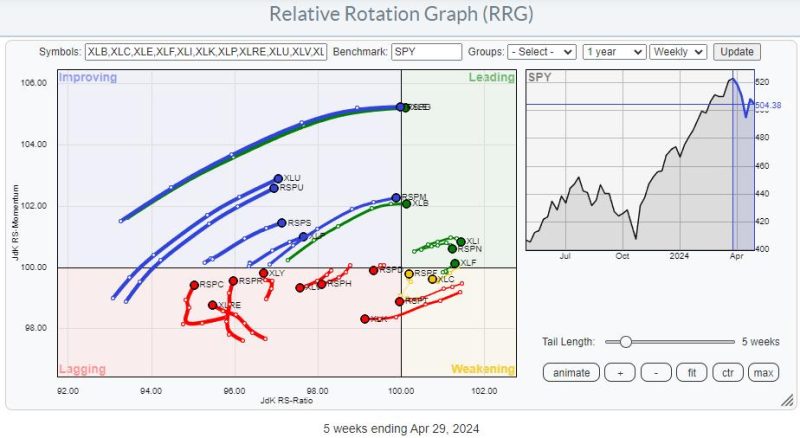
Unlock Profitable Trading Opportunities with Dynamic Relative Rotation Analysis
Relative rotation graphs (RRGs) are powerful tools used by traders and investors to identify trends, analyze performance, and potentially uncover trading opportunities within the financial markets. These graphs provide a visual representation of how different assets are moving in relation to a benchmark, offering insights into their relative strength and momentum.
The concept of RRGs is based on the idea that asset classes or individual securities move in interrelated cycles, with some outperforming while others underperform. By mapping these movements on a chart, RRGs allow analysts to compare the performance of various assets dynamically.
At the heart of RRGs are the four quadrants, representing different stages of relative performance. The leading quadrant (often labeled as Strong/Leading) showcases assets that are not only outperforming the benchmark but also exhibiting strong momentum. These are considered prime candidates for potential long positions, as they are showing relative strength compared to their peers.
On the flip side, the weakening quadrant (Weakening/Lagging) features assets that are underperforming the benchmark and losing momentum. These assets may be candidates for short positions or reducing exposure, as they are trailing behind their counterparts.
The improving quadrant (Improving/Weakening) highlights assets that are starting to pick up momentum but have yet to outperform the benchmark. While these assets may not be the strongest performers at the moment, they could present opportunities for investors to initiate positions before they become leaders.
Lastly, the lagging quadrant (Lagging/Improving) showcases assets that have been underperforming but are starting to gain momentum. These assets may have the potential for a turnaround, making them interesting candidates for further analysis.
By analyzing the movement of assets across these quadrants, traders and investors can gain valuable insights into market dynamics and potential trading opportunities. For instance, assets that are moving from the lagging quadrant towards the leading quadrant may signal a shift in relative strength and present a buying opportunity.
In conclusion, Relative Rotation Graphs offer a unique perspective on market dynamics and can help traders and investors identify potential trading opportunities based on relative strength and momentum. By understanding the four quadrants and tracking the movement of assets, market participants can make informed decisions to capitalize on changing market trends and optimize their portfolios.
