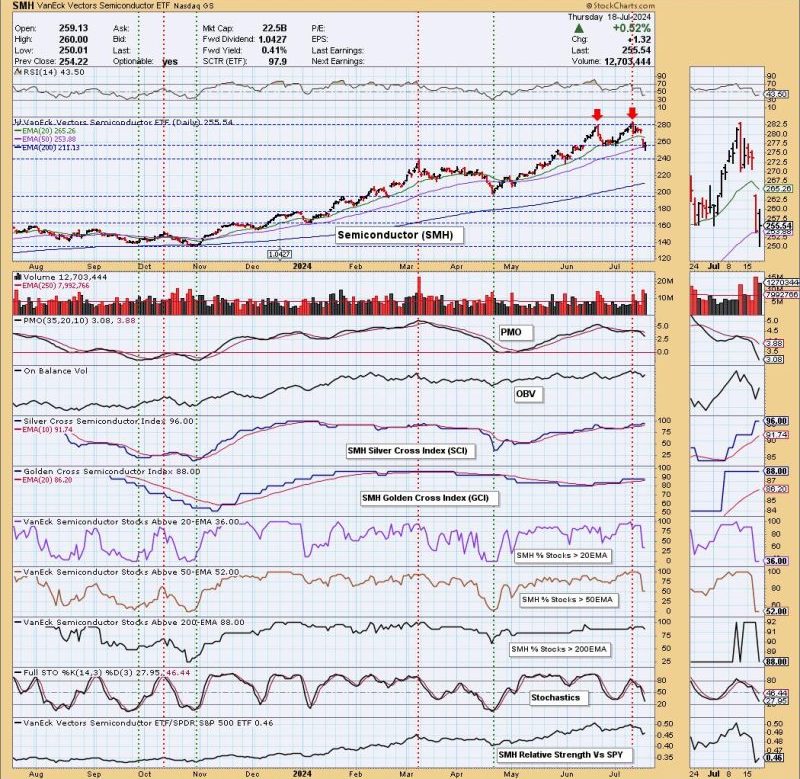
The semiconductor industry plays a crucial role in our technological advancement, powering various electronic devices that have become an integral part of our daily lives. In recent times, the semiconductor sector has attracted significant attention from investors and analysts alike. One of the key semiconductor exchange-traded funds, the iShares PHLX Semiconductor ETF (SMH), has been under close scrutiny due to the formation of a double top pattern on its chart.
### Understanding the Double Top Pattern
A double top pattern is a bearish reversal pattern that typically forms after an extended upward trend. It consists of two peaks at approximately the same price level, with a trough in between. The pattern indicates a weakening of the previous uptrend and a potential trend reversal.
In the case of SMH, the double top formation suggests that the ETF may have reached a significant resistance level, with the second peak failing to surpass the previous high. This points to a lack of strong buying interest at higher prices and could signal a shift in sentiment among market participants.
### Implications for Investors
#### 1. Potential Reversal Signal
The double top pattern on the SMH chart serves as a warning sign for investors who may have been bullish on the ETF. The formation of the pattern suggests that the uptrend may be losing momentum, and a potential trend reversal could be on the horizon. Traders monitoring this pattern may consider adopting a more cautious approach or even consider taking profits on long positions.
#### 2. Key Support and Resistance Levels
Identifying the key support and resistance levels associated with the double top pattern can help investors make informed decisions. In the case of SMH, the neckline – the line connecting the lows between the two peaks – serves as a crucial support level. A breakdown below this level could further validate the double top pattern and potentially trigger a more pronounced sell-off.
#### 3. Confirmation Through Volume
Confirmation through volume is an important aspect when analyzing chart patterns. In the context of the double top pattern on SMH, a surge in selling volume following a breakdown below the neckline would add credibility to the pattern and increase the likelihood of a sustained downtrend.
### Conclusion
In conclusion, the formation of a double top pattern on the SMH chart warrants careful attention from investors and traders. While chart patterns provide valuable insights into potential price movements, it is essential to combine technical analysis with other forms of analysis to make well-informed decisions. By understanding the implications of the double top pattern and monitoring key levels and volume dynamics, market participants can navigate the semiconductor sector with greater confidence and efficiency.

