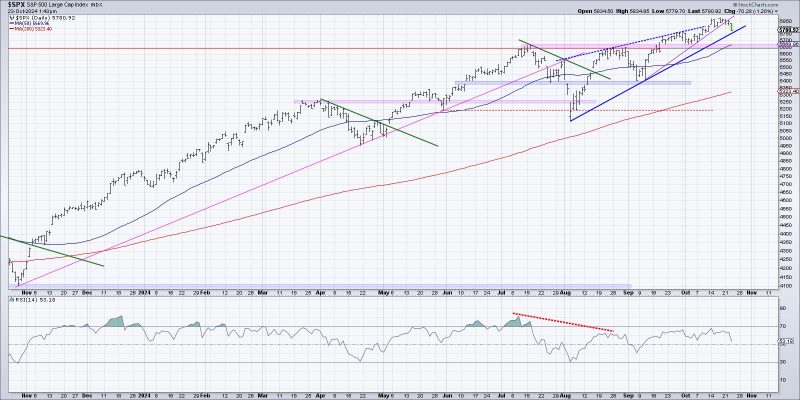
Unlock Your Investment Potential: 3 Creative Ways to Visualize the Beginning of a Distribution Phase
Visualization is a powerful tool that can aid investors in analyzing potential distribution phases in financial markets. By understanding and employing suitable visualization techniques, investors can make more informed decisions regarding their investments. Let’s explore three effective ways in which visualization can help in identifying the start of a potential distribution phase:
1. **Volume Analysis:** One key aspect of identifying a potential distribution phase is monitoring trading volume. A decrease in trading volume can indicate that fewer market participants are actively buying or selling an asset. Through visualization techniques such as volume bars, traders can easily identify patterns of declining volume that may suggest weakening interest in the asset. By comparing current volume trends to historical data, investors can gain valuable insights into potential shifts in market sentiment.
2. **Price Action Patterns:** Price action patterns are essential indicators of market dynamics and can provide significant clues about potential distribution phases. Visualizing price movements through techniques such as candlestick charts can help investors identify key reversal patterns like double tops, head and shoulders, or descending triangles, which could signal the onset of a distribution phase. By closely monitoring these patterns and their corresponding volumes, traders can anticipate potential selling pressures and adjust their investment strategies accordingly.
3. **Relative Strength Analysis:** Another valuable visualization tool for detecting potential distribution phases is relative strength analysis. By comparing the performance of an asset to a relevant market index or benchmark, investors can gauge the asset’s strength relative to the broader market. Visual representations like line charts or scatter plots can highlight divergences between the asset’s performance and the market index, indicating changes in investor sentiment. A sustained period of underperformance compared to the benchmark may suggest that the asset is entering a distribution phase as market participants gradually exit their positions.
In conclusion, visualization plays a crucial role in identifying the start of potential distribution phases in financial markets. By incorporating volume analysis, price action patterns, and relative strength analysis into their analytical toolkit, investors can enhance their ability to spot early signs of distribution and make more informed investment decisions. Through a combination of technical analysis and visual data representation, traders can navigate market trends more effectively and stay ahead of potential market reversals.
