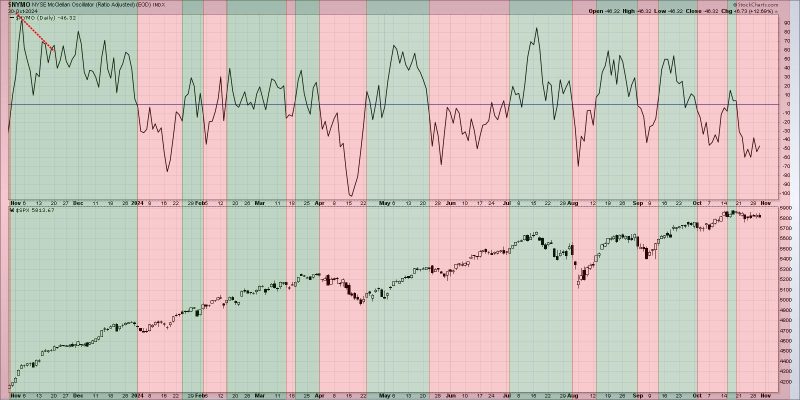
Breadth Divergences: A Key Indicator for Market Sentiment
Market analysts and traders alike keep a close eye on various indicators to gauge the health and direction of the market. One such indicator that has gained prominence in recent years is breadth divergences. These divergences can provide valuable insights into market sentiment and potential shifts in trends.
Breadth divergences refer to situations where the number of stocks participating in a market move diverges from the movement of the overall market indices. In a healthy, bullish market, one would expect to see a large number of stocks rallying along with the major indices. However, when fewer stocks are participating in the upward movement of the market, it could signal underlying weakness and potential trouble ahead.
One common breadth divergence indicator that analysts look at is the Advance-Decline Line (AD Line). The AD Line tracks the number of advancing stocks versus declining stocks over a specific period. If the AD Line is trending upwards while the market indices are also rising, it suggests broad participation and strength in the market. On the other hand, if the AD Line is flat or declining while the indices are moving higher, it could indicate a lack of conviction in the rally and a potential warning sign for investors.
Another important breadth divergence indicator is the percentage of stocks trading above their moving averages. In a robust uptrend, a high percentage of stocks should be trading above their moving averages, indicating widespread strength in the market. However, if the market indices are climbing while fewer stocks are trading above their moving averages, it could point to a narrowing participation and potential weakness in the rally.
Identifying breadth divergences early can provide traders and investors with valuable insights into potential market turning points. By paying attention to these divergences and combining them with other technical and fundamental indicators, market participants can better assess the overall health of the market and make informed decisions about their investment strategies.
In conclusion, breadth divergences are a key indicator for assessing market sentiment and identifying potential shifts in trends. By monitoring indicators such as the Advance-Decline Line and the percentage of stocks trading above their moving averages, traders can gain valuable insights into the participation and strength of market moves. Incorporating breadth divergences into one’s analysis can help navigate uncertain market conditions and make better-informed investment decisions.

